📖 COCOMO Model: A mathematical model developed by Barry Boehm to estimate the effort, cost, and schedule for a software project. It uses project size (LOC) and other factors to calculate estimates.
💡 Real-life Analogy — Recipe Scaling:
If a recipe for 4 people needs 2 cups of flour, cooking for 8 people needs about 4 cups. But it's not exactly double — you might need slightly less (efficiency). COCOMO similarly scales effort based on project size with adjustments.
Three Levels of COCOMO:
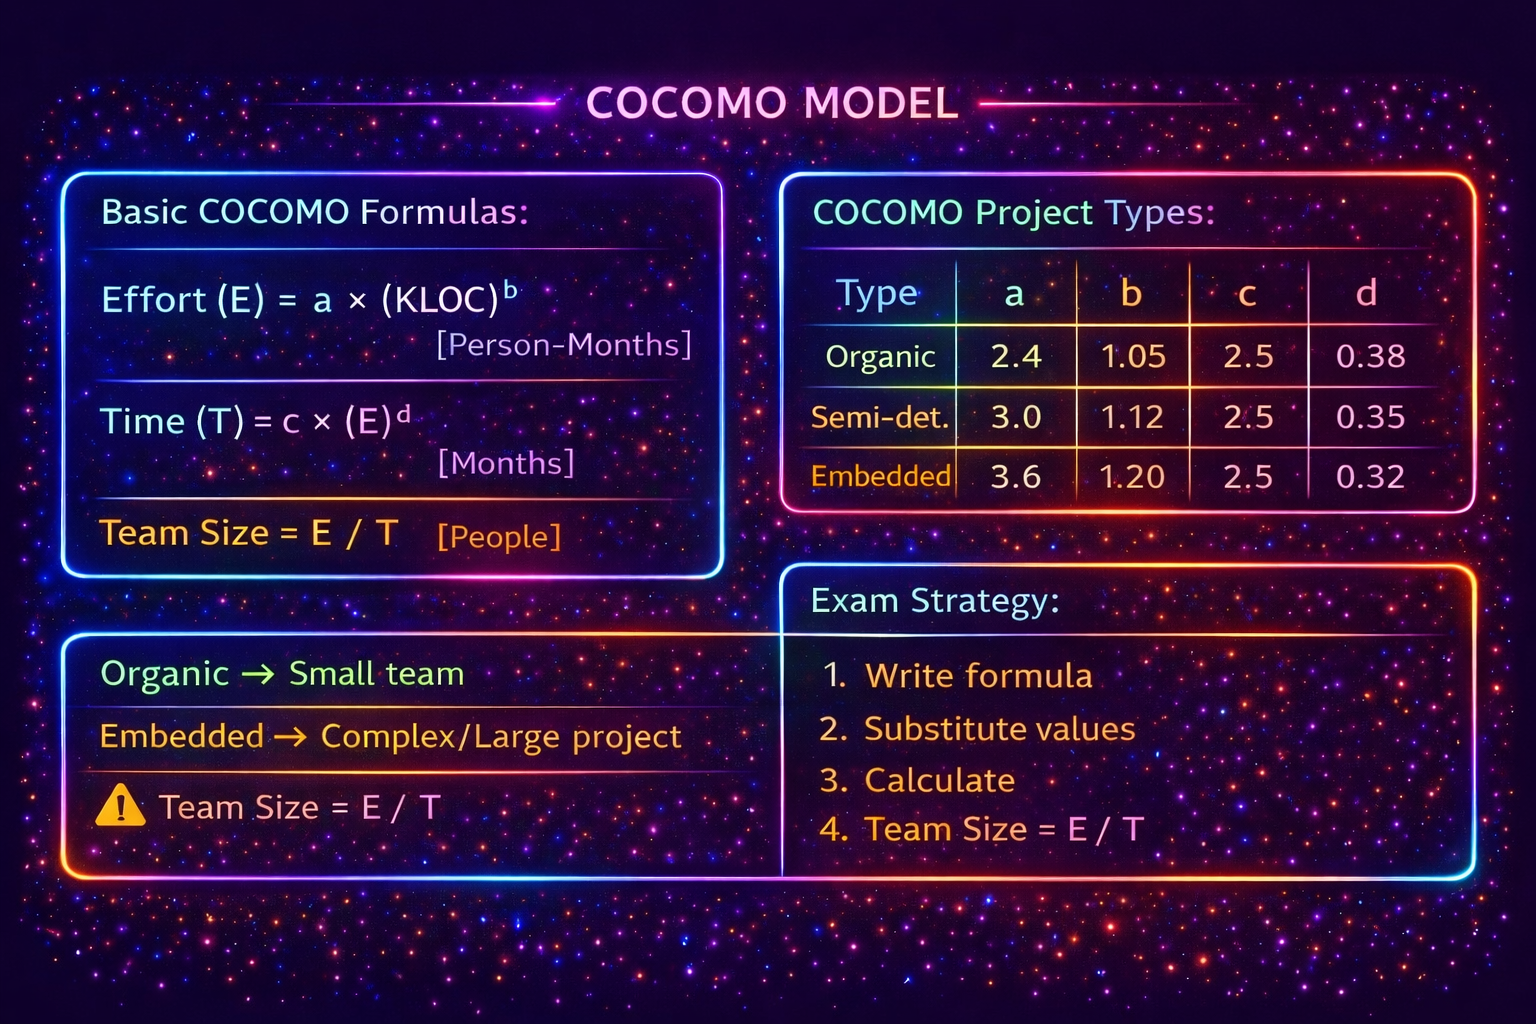
1. Basic COCOMO:
Quick, rough estimate based ONLY on project size (LOC).
| Project Type |
a |
b |
c |
d |
Example |
| Organic |
2.4 |
1.05 |
2.5 |
0.38 |
Small team, familiar domain |
| Semi-detached |
3.0 |
1.12 |
2.5 |
0.35 |
Medium team, some complexity |
| Embedded |
3.6 |
1.20 |
2.5 |
0.32 |
Large team, hardware constraints |
💡 Solved Example — Basic COCOMO:
Problem: Organic project with 20,000 LOC (20 KLOC). Calculate Effort and Time.
Solution:
Given: Organic → a=2.4, b=1.05, c=2.5, d=0.38, KLOC=20
Step 1: Calculate Effort
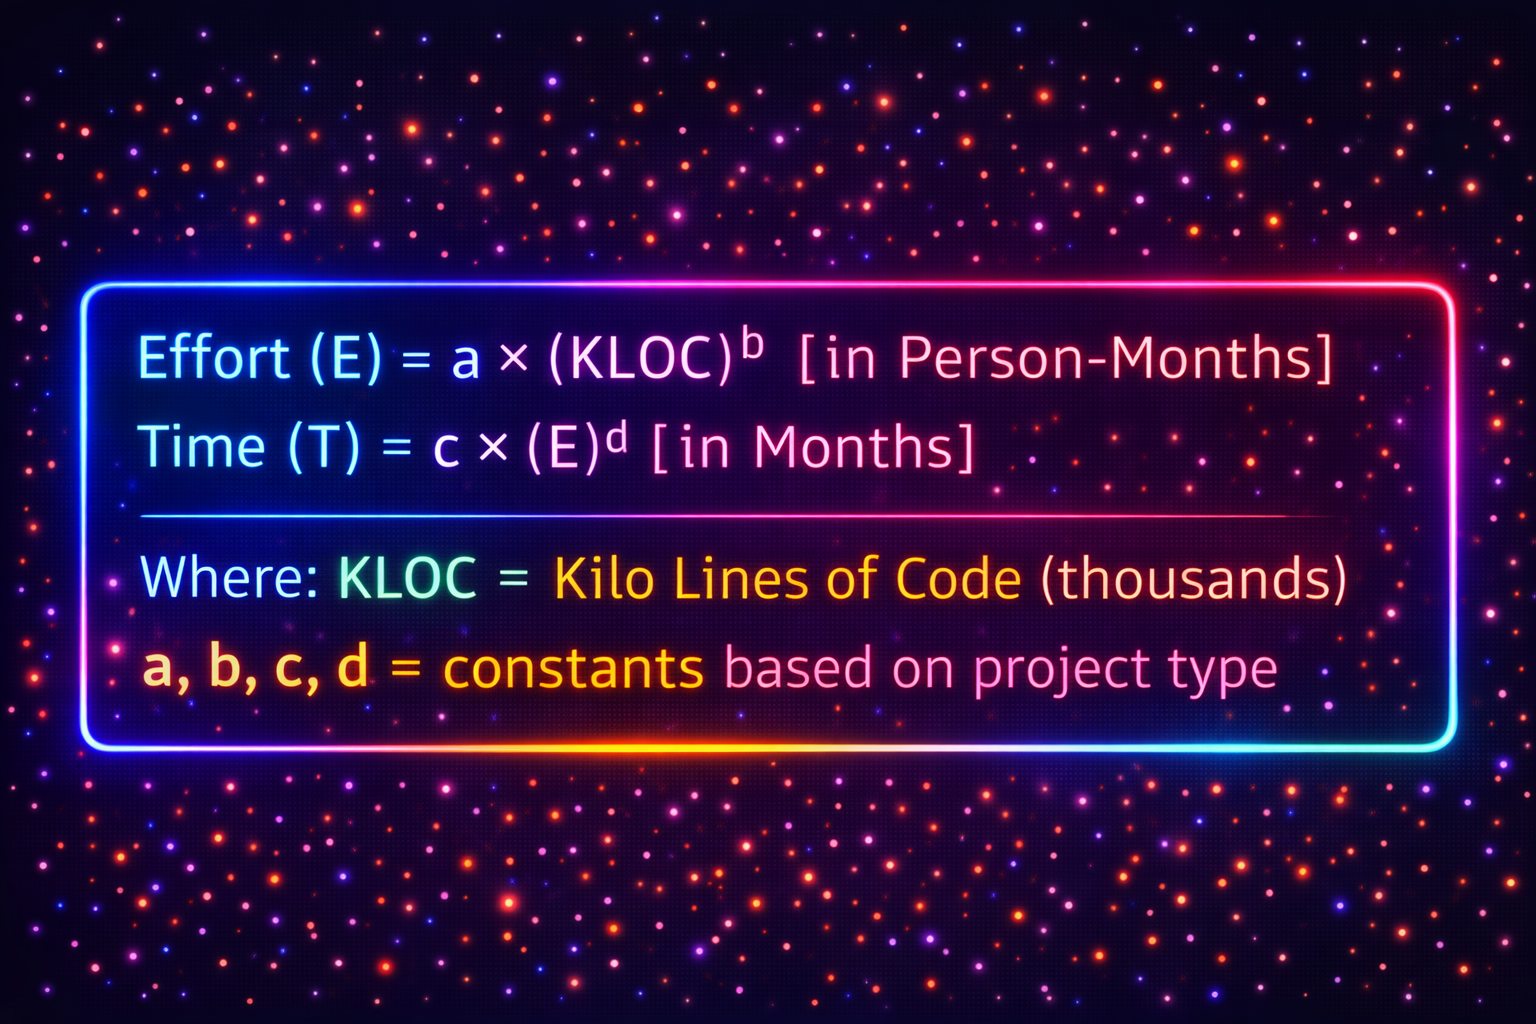
E = a × (KLOC)^b
E = 2.4 × (20)^1.05
E = 2.4 × 21.27
E = 51 Person-Months
Step 2: Calculate Time
T = c × (E)^d
T = 2.5 × (51)^0.38
T = 2.5 × 4.29
T = 10.7 Months
Step 3: Calculate Team Size
Team = Effort / Time
Team = 51 / 10.7
Team = 4.8 ≈ 5 people
Answer: 51 person-months effort, 10.7 months duration, 5-person team.
2. Intermediate COCOMO
Intermediate COCOMO:
More accurate than Basic. Uses 15 cost drivers (factors that affect effort):
- Product attributes: Reliability, database size, complexity
- Hardware attributes: Execution time, memory constraints
- Personnel attributes: Experience, capability
- Project attributes: Tools, schedule, methods
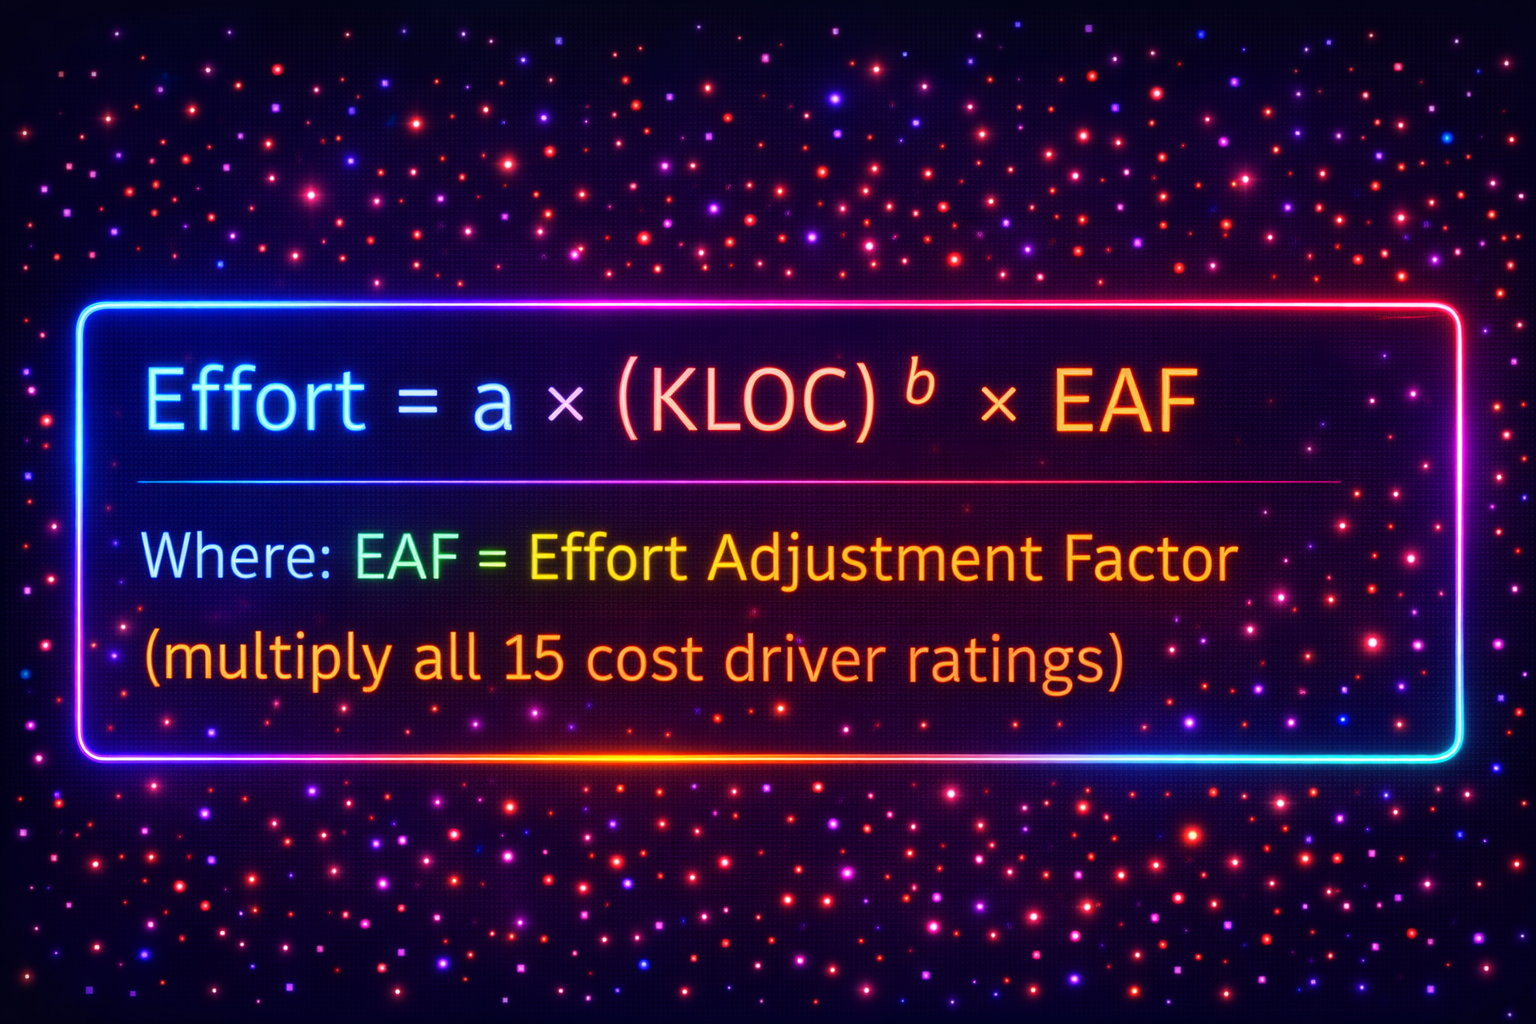
Each cost driver rated: Very Low, Low, Normal, High, Very High → assigned a multiplier.
3. Detailed COCOMO
Detailed COCOMO:
Most accurate. Considers cost drivers at each phase (requirements, design, coding, testing). Different multipliers for each phase.
Used for large, complex projects where high accuracy needed.
✅ COCOMO Advantages:
- Widely used and validated
- Mathematical basis (not just guessing)
- Accounts for project complexity
- Three levels for different accuracy needs
❌ COCOMO Limitations:
- Needs LOC estimate (hard to get early)
- Constants (a, b, c, d) may not fit your organization
- Doesn't work well for modern Agile projects
- Based on old data (1981 — before internet era)
2.4 Project Scheduling
📖 Project Scheduling: The process of defining tasks, assigning resources, setting start/end dates, and sequencing activities to complete the project on time.
💡 Real-life Analogy — Making a Meal:
Cooking dinner requires scheduling:
- Chop vegetables (15 min) → Can do in parallel with boiling water
- Boil water (10 min) → Must finish before adding pasta
- Cook pasta (12 min) → Depends on boiling water
- Prepare sauce (8 min) → Can do while pasta cooks
Some tasks can happen together (parallel), some must wait for others (dependencies). Project scheduling is the same!
Scheduling Tools:
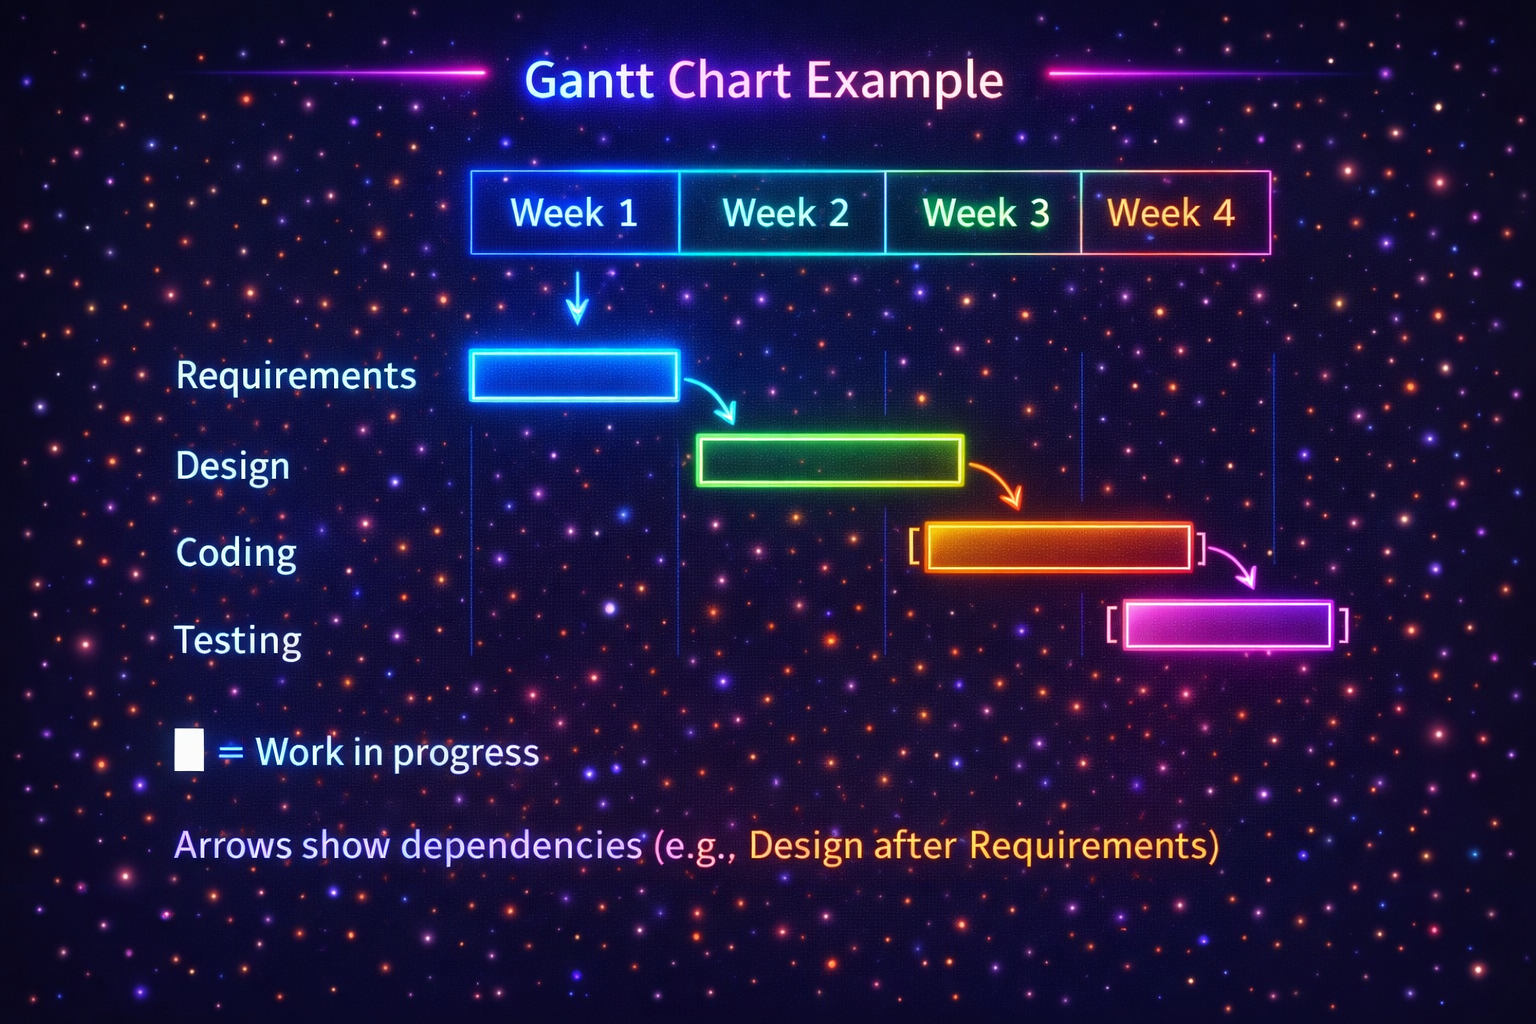
1. Gantt Chart:
A horizontal bar chart showing tasks on timeline. Each bar = one task. Length = duration.
Good for: Simple visualization, tracking progress.
2. PERT Chart (Program Evaluation Review Technique):
Network diagram showing task dependencies.
Critical Path: Longest sequence of tasks. Delays here delay entire project.
3. CPM (Critical Path Method):
Similar to PERT. Identifies:
- Critical Path: Tasks that must finish on time (no slack)
- Slack Time: How much a task can be delayed without delaying project
Example: If Task C takes 2 days but you have 5 days available → 3 days slack.
💡 Why Scheduling Matters:
- Team knows what to do and when
- Identifies critical tasks (focus here!)
- Helps allocate resources efficiently
- Tracks project progress
- Warns about potential delays early
2.5 Risk Analysis & Management
📖 Risk: An uncertain event or condition that, if it occurs, has a negative effect on the project (delays, cost overrun, quality issues).
Risk Management: Process of identifying, analyzing, and responding to project risks.
💡 Real-life Example — Outdoor Wedding:
Risk: What if it rains on wedding day?
Risk Management:
- Identify: Rain is a risk
- Analyze: Check weather forecast, probability = 30%
- Impact: High (ruin the event)
- Mitigation: Book backup indoor venue, rent tent
Types of Software Project Risks:
❌ 1. Technical Risks: Technology problems
• New/unfamiliar technology
• Complex algorithms
• Integration with legacy systems
Example: "We've never used React before — might take longer to learn."
❌ 2. Schedule Risks: Time-related problems
• Unrealistic deadlines
• Task dependencies
• Resource unavailability
Example: "Key developer taking vacation mid-project."
❌ 3. Budget/Cost Risks: Money problems
• Underestimated costs
• Price changes for tools/services
• Unexpected expenses
Example: "Cloud hosting costs more than budgeted."
❌ 4. People/Team Risks: Human resource problems
• Team member quits
• Skill gaps
• Poor communication
Example: "Our only database expert left the company."
❌ 5. Requirements Risks: Unclear/changing requirements
• Scope creep
• Misunderstood requirements
• Client keeps changing mind
Example: "Client wants completely different UI after we built it."
Risk Management Process:
Step 1 — Risk Identification:
List all possible risks. Brainstorm with team, check past projects.
Technique: Checklist, Brainstorming, Interviews, SWOT analysis
Step 2 — Risk Analysis:
For each risk, assess:
- Probability: How likely? (Low/Medium/High or 0-100%)
- Impact: How bad if it happens? (Low/Medium/High)
- Risk Exposure = Probability × Impact
| Risk |
Probability |
Impact |
Risk Level |
| Key developer quits |
High (70%) |
High |
Critical |
| Minor bug in UI |
Low (20%) |
Low |
Minor |
| Requirements change |
Medium (50%) |
High |
Major |
Step 3 — Risk Mitigation (Planning):
For high-priority risks, create action plans:
- Avoid: Eliminate the risk (don't use risky technology)
- Reduce: Lower probability or impact (training, prototyping)
- Transfer: Shift risk to others (insurance, outsourcing)
- Accept: Acknowledge risk but do nothing (for low-priority risks)
Step 4 — Risk Monitoring:
Track risks throughout project. Watch for new risks. Update mitigation plans.
💡 Best Practice: Hold weekly risk review meetings. Maintain a risk register (document tracking all risks). Don't ignore small risks — they can become big problems!
2.6 Software Quality & Management
📖 Software Quality: The degree to which software meets its requirements and user expectations. Quality software is correct, reliable, efficient, usable, and maintainable.
💡 Real-life Analogy — Restaurant Quality:
A quality restaurant means:
- Correctness: You get what you ordered (not wrong dish)
- Reliability: Food tastes consistent every time
- Performance: Food arrives quickly
- Usability: Easy to order, friendly staff
- Maintainability: Clean, hygienic kitchen
Similarly, quality software meets all these criteria.
Quality Attributes:
✅ 1. Correctness: Software works according to requirements — no bugs.
✅ 2. Reliability: Works consistently without failures over time.
✅ 3. Efficiency: Uses resources (CPU, memory, network) optimally.
✅ 4. Usability: Easy to learn and use. Good user interface.
✅ 5. Maintainability: Easy to fix bugs and add features later.
✅ 6. Portability: Works on different platforms (Windows, Mac, Linux, mobile).
Quality Management Activities:
1. Quality Planning:
Define quality standards and metrics. What does "good quality" mean for this project?
Example: "App must load in under 2 seconds. Crash rate below 0.1%."
2. Quality Assurance (QA):
Process-focused. Ensure the RIGHT processes are followed during development.
- Code reviews
- Following coding standards
- Using version control
- Regular testing
Goal: Prevent defects by doing things right from the start.
3. Quality Control (QC):
Product-focused. Check if the FINAL product meets quality standards.
- Testing (unit, integration, system, UAT)
- Finding and fixing bugs
- Performance testing
- Security testing
Goal: Detect and remove defects before release.
| Aspect |
Quality Assurance (QA) |
Quality Control (QC) |
| Focus | Process | Product |
| Goal | Prevent defects | Detect defects |
| When | Throughout project | After product ready |
| Example | Code reviews, standards | Testing, bug fixing |
2.7 Software Configuration Management
📖 Configuration Management (CM): A process of systematically managing, organizing, and controlling changes to software artifacts (code, documents, configs) throughout the project lifecycle.
💡 Real-life Analogy — Google Docs Version History:
Remember writing a college assignment:
- You save versions: assignment_v1.doc, assignment_v2.doc, assignment_final.doc, assignment_final_final.doc
- Later you want to see what changed between versions
- You collaborate with groupmates — who changed what?
Google Docs solves this with version history. Similarly, Configuration Management uses tools like Git to track all code changes.
Why Configuration Management?
✅ Track Changes: Know who changed what, when, and why.
✅ Collaboration: Multiple developers work on same codebase without conflicts.
✅ Rollback: If new code breaks something, revert to previous working version.
✅ Parallel Development: Work on new features while maintaining stable version.
Configuration Management Activities:
1. Version Control:
Track changes to code over time. Use tools like Git, SVN.
- Repository: Central storage for all code versions
- Commit: Save changes with description
- Branch: Create separate copy for experiments
- Merge: Combine changes from different branches
Example: GitHub, GitLab, Bitbucket
2. Change Control:
Manage requests for changes systematically.
- User/client requests feature or bug fix
- Change request reviewed by team
- Assess impact (time, cost, risk)
- Approve or reject
- If approved → implement, test, deploy
3. Configuration Audit:
Verify that deliverables match what was agreed upon. Check documentation is updated.
4. Build Management:
Automate process of compiling code, running tests, creating deployable version.
Tools: Jenkins, Travis CI, GitHub Actions
💡 Best Practices:
- Commit code frequently (at least daily)
- Write meaningful commit messages ("Fixed login bug" not "changes")
- Never commit directly to main branch — use feature branches
- Tag releases (v1.0, v2.0)
- Back up repositories regularly
❌ Without Configuration Management: Lost code, merge conflicts, can't find bugs introduced, team stepping on each other's work, chaos!
🖥️
Chapter 3 — User Interface Design
🖥️ USER INTERFACE DESIGN — MIND MAP
Good UI Characteristics → Simple, consistent, feedback, forgiving
Command Language → Text commands (CLI) — powerful but requires learning
Menu-Based → Select from list — easy for beginners
Direct Manipulation → Drag & drop, touch — intuitive & visual
Fundamentals → User control, clear language, help & documentation
3.1 What is User Interface (UI)?
📖 Definition: User Interface (UI) is the space where humans interact with computers. It includes everything users see, touch, or hear — screens, buttons, menus, keyboard, mouse, touchscreen.
💡 Real-life Analogy — Car Dashboard:
A car's dashboard is its user interface:
- Steering wheel: Control direction (input)
- Speedometer: Shows speed (output/feedback)
- Buttons: Control AC, music, lights (input)
- Warning lights: Alert problems (feedback)
You don't need to understand how the engine works — just interact with the dashboard. Similarly, good software UI hides complexity and shows only what users need.
⚠️ Key Point: UI is the ONLY part of software that users see and interact with. If UI is bad, users think the entire software is bad — even if the code is perfect!
3.2 Characteristics of Good User Interface Design
📖 Good UI Design: A user interface that is easy to learn, efficient to use, pleasant, and helps users accomplish their tasks quickly without confusion or errors.
8 Golden Rules of Good UI:
✅ 1. Simplicity: Keep it simple. Don't overwhelm users with too many options.
Example: Google homepage — just a search box. That's it. Simple = powerful.
✅ 2. Consistency: Same actions should work the same way everywhere.
Example: "Back" button should always be in same place. Colors mean same thing throughout app.
✅ 3. Visibility: Important features should be easy to find. Don't hide critical functions.
Example: "Save" button should be visible, not buried in a menu.
✅ 4. Feedback: Tell users what's happening. System should respond to every action.
Example: When uploading file, show progress bar. When button clicked, show it was pressed.
✅ 5. Tolerance (Forgiving): Prevent errors. If errors happen, help users recover easily.
Example: "Are you sure you want to delete?" confirmation. Undo button.
✅ 6. Efficiency: Let experienced users work quickly with shortcuts.
Example: Keyboard shortcuts (Ctrl+S to save), recently used files list.
✅ 7. Memorability: Users should remember how to use it even after not using for a while.
Example: Icons that look like real objects (trash can for delete, printer icon for print).
✅ 8. Clear Language: Use words users understand. No technical jargon.
Bad: "Error 404 - Resource not found"
Good: "Sorry, we couldn't find that page."
❌ Signs of Bad UI:
- Users can't figure out how to do basic tasks
- Buttons don't do what users expect
- No feedback (users don't know if action worked)
- Can't undo mistakes
- Cluttered screen with too much information
- Inconsistent design (buttons look different everywhere)
💡 Real Example — ATM Machine:
Good UI characteristics in ATM:
- Simple: Clear options (Withdraw, Deposit, Balance)
- Consistent: "Cancel" button always at same spot
- Feedback: Shows "Processing..." while working
- Forgiving: "Are you sure?" before large withdrawals
- Clear language: "Enter amount" not "Input numerical value"
3.3 Command Language User Interface (CLI)
📖 Command Language Interface: A text-based interface where users type commands to interact with the computer. Also called CLI (Command Line Interface) or Console.
💡 Examples:
- Windows Command Prompt (CMD)
- Linux Terminal / Bash
- Mac Terminal
- Git commands
Example CLI Commands:
$ ls # List files in current directory
$ cd Documents # Change to Documents folder
$ mkdir myproject # Create new folder
$ rm file.txt # Delete file
$ git commit -m "fix" # Git commit with message
User types command → Press Enter → System executes → Shows result
Advantages of CLI:
✅ Powerful & Flexible: Can do complex tasks with one command.
Example: Delete all .txt files with one command instead of clicking each file.
✅ Fast for Experts: Typing commands is faster than clicking through menus.
✅ Automation: Write scripts to repeat tasks automatically.
✅ Low Resource Usage: No graphics needed — runs on slow/old computers.
✅ Remote Access: Can control computers remotely over network (SSH).
Disadvantages of CLI:
❌ Hard to Learn: Must memorize commands and syntax. No visual clues.
❌ Not Beginner-Friendly: Scary black screen with blinking cursor. No menus to guide.
❌ Easy to Make Mistakes: One typo = command fails or does wrong thing (dangerous with delete commands!).
❌ No Visual Feedback: Hard to see results of complex operations.
💡 When to Use CLI: System administration, developers/programmers, automation tasks, servers without GUI, power users who want speed.
3.4 Menu-Based User Interface
📖 Menu-Based Interface: A UI where users select options from a list of choices (menus). Users navigate by clicking or pressing numbers/keys corresponding to menu items.
💡 Real-life Analogy — Restaurant Menu:
At a restaurant, you pick from a menu:
- See all available options
- Choose what you want
- Don't need to remember names of dishes
- Can browse before deciding
Software menu is similar — shows available actions, user picks one.
Example Menu Interface:
===== Main Menu =====
1. File
2. Edit
3. View
4. Help
5. Exit
Enter choice (1-5): 1
===== File Menu =====
1. New
2. Open
3. Save
4. Close
5. Back to Main Menu
Enter choice (1-5): _
Types of Menus:
1. Pull-down Menus: Click menu name → list drops down.
Example: File, Edit, View menus in Microsoft Word.
2. Pop-up Menus: Right-click → menu appears at cursor position.
Example: Right-click on desktop → see options like "Refresh", "Properties".
3. Hierarchical Menus: Main menu → submenu → sub-submenu.
Example: Start Menu → Programs → Microsoft Office → Word.
4. Linear Menus: Simple numbered list (like ATM).
Example: "Press 1 for Balance, 2 for Withdraw, 3 for Deposit".
Advantages of Menu-Based UI:
✅ Easy for Beginners: See all options — no need to memorize commands.
✅ Less Training Needed: Self-explanatory — users can explore.
✅ Reduces Errors: Can only pick from valid options — can't make typos.
✅ Predictable: Users know what options exist.
Disadvantages of Menu-Based UI:
❌ Slow for Experts: Clicking through menus is slower than typing commands.
❌ Too Many Menus = Confusing: Deep hierarchies (7 levels deep) frustrate users.
❌ Limited Flexibility: Can only do what's in the menu — no custom actions.
💡 When to Use Menus: Applications for general users, kiosks, ATMs, mobile apps, systems where users don't need training.
3.5 Direct Manipulation Interfaces
📖 Direct Manipulation: A UI style where users interact with objects on screen directly — dragging, dropping, resizing, touching. Objects look and behave like real-world counterparts. What You See Is What You Get (WYSIWYG).
💡 Real-life Analogy — Playing with Toys:
A child playing with toy blocks:
- Picks up block (drag)
- Places it somewhere (drop)
- Sees immediate result
- If mistake → just move block again
No commands needed. Just touch and manipulate. Direct manipulation UI works the same way!
💡 Examples of Direct Manipulation:
- Desktop Icons: Drag file to trash can to delete
- Touchscreen: Pinch to zoom, swipe to scroll
- Graphic Editors: Drag corner of image to resize
- Games: Click and drag character to move
- Map Apps: Drag map around, drop pin on location
Principles of Direct Manipulation:
✅ 1. Continuous Representation: Objects always visible on screen (not hidden in menus).
✅ 2. Physical Actions: Use mouse/finger to directly act on objects (drag, click, touch).
✅ 3. Rapid Feedback: Actions show results immediately (not after pressing "OK").
✅ 4. Reversible: Easy to undo actions (Ctrl+Z, shake phone to undo).
Advantages of Direct Manipulation:
✅ Intuitive & Natural: Feels like manipulating real objects. Easy to learn.
✅ Visual & Engaging: Users see what they're doing — more satisfying.
✅ Immediate Feedback: Results appear instantly — users stay in control.
✅ Less Training: Exploration-based learning — try things and see what happens.
✅ Low Error Rate: See effects before confirming — can cancel if wrong.
Disadvantages of Direct Manipulation:
❌ Screen Space: Needs large display — objects must be visible. Doesn't work well on small screens.
❌ Slow for Complex Tasks: Dragging 1000 files one by one is tedious. CLI command would be faster.
❌ Not Good for Blind Users: Relies on visual + mouse/touch. Screen readers can't describe drag-drop actions well.
❌ Hard to Automate: Can't script direct manipulation actions easily.
💡 When to Use Direct Manipulation: Graphic design tools, games, mobile apps, CAD software, anything visual or creative.
3.6 Comparison: CLI vs Menu vs Direct Manipulation
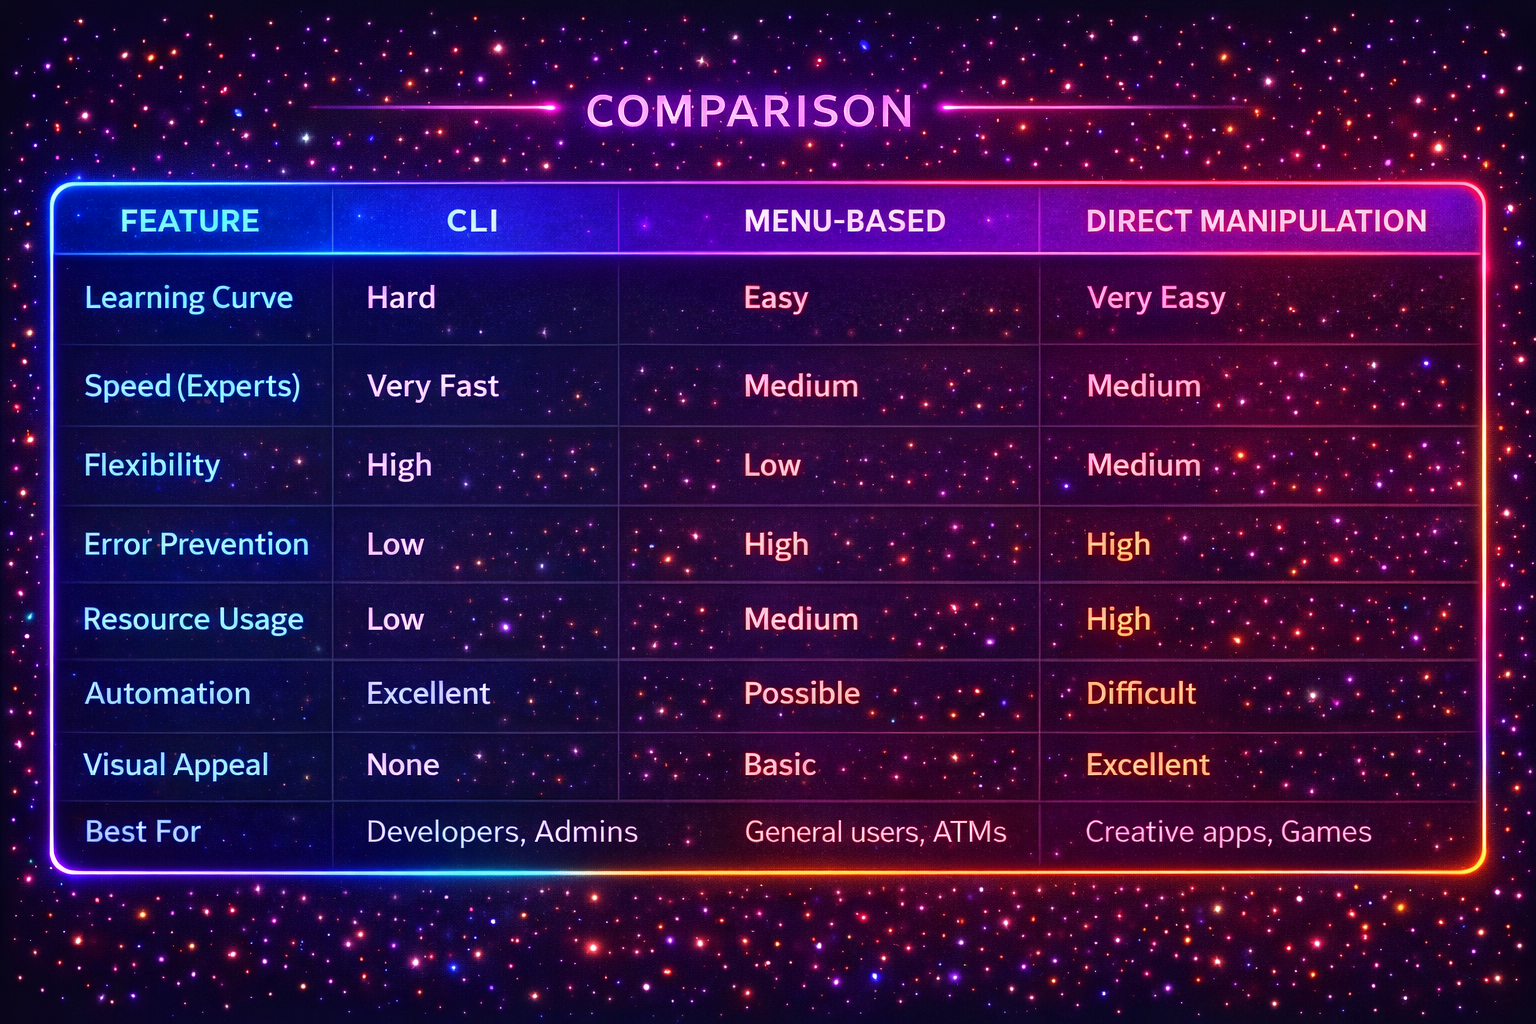
| Feature |
CLI |
Menu-Based |
Direct Manipulation |
| Learning Curve |
Hard |
Easy |
Very Easy |
| Speed (Experts) |
Very Fast |
Medium |
Medium |
| Flexibility |
High |
Low |
Medium |
| Error Prevention |
Low |
High |
High |
| Resource Usage |
Low |
Medium |
High |
| Automation |
Excellent |
Possible |
Difficult |
| Visual Appeal |
None |
Basic |
Excellent |
| Best For |
Developers, Admins |
General users, ATMs |
Creative apps, Games |
💡 Hybrid Approach (Best Practice):
Modern software combines all three!
Example: Microsoft Word has menus (File, Edit),
direct manipulation (drag text),
AND keyboard shortcuts (CLI-like).
Users choose what they prefer!
⚡
Ready for Exam?
Sab padh liya? Ab Quick Revision karo — formulas, key points aur exam tips ek jagah!
Quick Revision Karo →
⚡
Quick Revision — Last Minute Exam Prep!
📌 How to use: Read this 15 minutes before exam. Includes definitions, tricks, formulas, examples — everything you need!
🎨 Chapter 1 — Software Design
📖 What is Software Design?
Transforming requirements into implementable structure. Like creating a blueprint before building a house.
💡 Trick: Requirements → Design → Code
Example: Client says "I want login" → You design Login module (inputs, outputs, database) → Then code it
🔄 Design Process (6 Steps):
1. Understand requirements
2. Identify modules
3. Define interactions
4. Design data structures
5. Design algorithms
6. Create documentation
Exam Tip: Always draw a diagram showing modules!
✅ Core Design Concepts (Remember "ACMCR"):
A - Abstraction = Hide complexity
C - Cohesion = HIGH is good (module does ONE thing)
M - Modularity = Break into parts
C - Coupling = LOW is good (independent modules)
R - Refinement = Top-down, add details gradually
⚠️ Common Mistake: Students confuse High Cohesion vs Low Coupling!
Remember: HIGH quality INSIDE module, LOW dependency BETWEEN modules
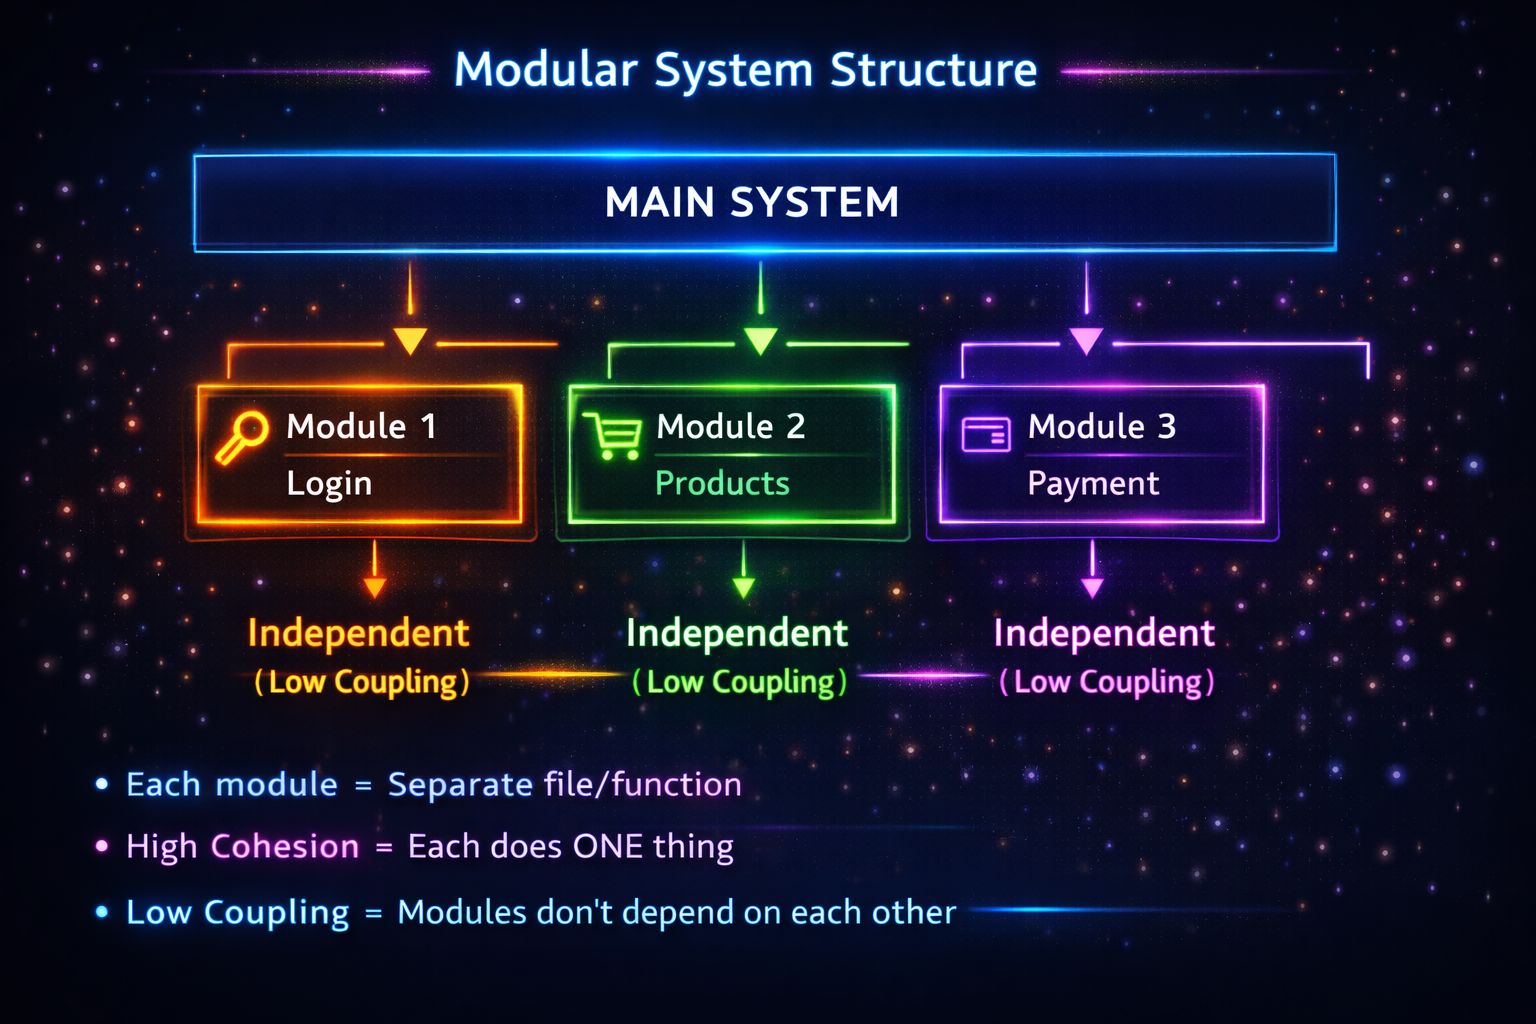
💡 Modular Design — Quick Points:
What: Break system into independent modules
Example: Netflix = Login module + Streaming module + Payment module
Benefits (Remember "TERMS"):
• Testable - Test each separately
• Easy to maintain
• Reusable - Use in other projects
• Multiple teams can work parallel
• Simple to understand
Good Module = High Cohesion + Low Coupling + Clear Interface
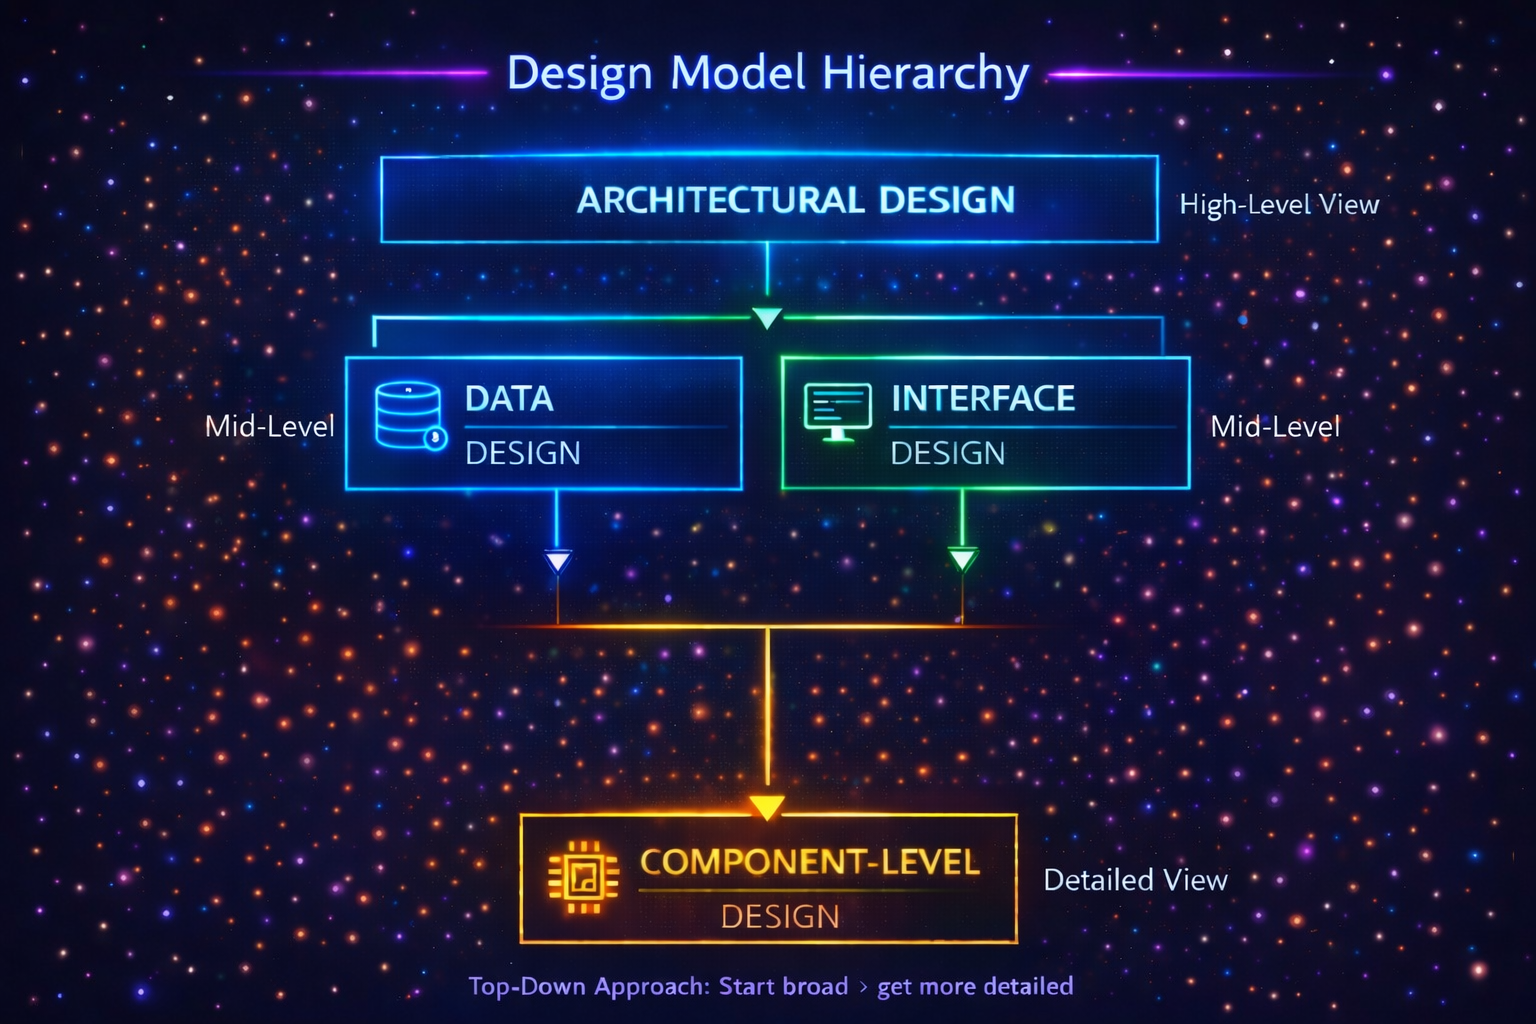
Design Model (4 Types):
1. DATA Design → Database structure
Example: Tables for Users, Products, Orders
2. ARCHITECTURAL → Big picture structure
Example: Frontend ↔ Backend ↔ Database
3. INTERFACE → How modules interact
Example: Function signatures, APIs
4. COMPONENT-LEVEL → Detailed module logic
Example: Login module internal algorithm
Exam Pattern: "Explain Design Model" = Define all 4 types + 1 example each
📐 Design Approaches (Table Trick):
| Approach | Focus | Language | Use |
|---|
| Structured | Functions | C | Small projects |
| Object-Oriented | Classes/Objects | Java | Large projects |
| Component-Based | Reusable parts | React | Web apps |
📊 Chapter 2 — Project Management
📋 Project Planning Essentials:
Remember "SORTED":
Scope - What's in/out?
Objectives - What to achieve?
Resources - People, tools, money
Tasks - WBS (Work Breakdown Structure)
Estimate - Time & cost
Delegate - Assign responsibilities
Real Analogy: Like planning a road trip → Destination, route, budget, who's driving
💡 Solved Example (Practice This!):
Q: Organic project, 25 KLOC. Find Effort, Time, Team.
Solution:
Given: Organic → a=2.4, b=1.05, c=2.5, d=0.38, KLOC=25
E = 2.4 × (25)^1.05 = 2.4 × 27.14 = 65 PM
T = 2.5 × (65)^0.38 = 2.5 × 4.64 = 11.6 months
Team = 65/11.6 = 5-6 people
📅 Scheduling Tools (Quick Compare):
Gantt Chart: Bar chart → Shows timeline → Easy to understand
PERT Chart: Network diagram → Shows dependencies → Finds critical path
CPM: Like PERT → Identifies critical path (longest path)
Critical Path = Longest path = Delays here = Project delays
Slack Time = How much delay OK without affecting project
⚠️ Risk Management (4 Steps - "IAMM"):
Identify risks → List all possible problems
Analyze → Probability × Impact = Risk Exposure
Mitigate → Avoid/Reduce/Transfer/Accept
Monitor → Track throughout project
5 Risk Types (Remember "TSBPR"):
Technical, Schedule, Budget, People, Requirements
Exam Trick: Always mention Risk Exposure = P × I
✅ QA vs QC (Never Confuse!):
| QA | QC |
|---|
| Focus | Process | Product |
| Goal | PREVENT bugs | DETECT bugs |
| When | Throughout | After product ready |
| Example | Code reviews | Testing |
Mnemonic: QA = Quality Assurance = PREVENT (proactive)
QC = Quality Control = DETECT (reactive)
🔧 Configuration Management:
What: Managing code changes systematically
Tool: Git (most common)
Key Terms:
• Repository = Central code storage
• Commit = Save changes
• Branch = Separate copy for features
• Merge = Combine branches
Why Important: Track changes, collaboration, rollback, parallel development
🖥️ Chapter 3 — User Interface Design
✨ Good UI — 8 Golden Rules (Remember "SCVFTEMM"):
Simplicity - Keep it simple (Google homepage)
Consistency - Same actions work same way
Visibility - Important features easy to find
Feedback - Tell users what's happening (progress bars)
Tolerance - Forgiving, allow undo
Efficiency - Shortcuts for experts
Memorability - Easy to remember
Meaningful language - No jargon
Example: ATM = Simple options, consistent layout, feedback ("Processing"), forgiving ("Are you sure?")
| Interface | CLI | Menu | Direct Manipulation |
|---|
| Input | Type commands | Select from list | Drag, drop, touch |
| Learning | Hard | Easy | Very Easy |
| Speed | Very Fast | Medium | Medium |
| Errors | High | Low | Low |
| Example | Terminal | ATM | Touchscreen |
| Best For | Developers | General users | Creative apps |
💡 Quick Examples to Remember:
CLI: Linux Terminal - Type "ls" to list files
Pros: Fast, powerful | Cons: Must memorize commands
Menu-Based: Restaurant menu - Choose from options
Pros: Easy for beginners | Cons: Slow for experts
Direct Manipulation: Drag file to trash
Pros: Intuitive, visual | Cons: Needs screen space
Exam Tip: Comparison questions = Always make a table!
🎯 Last Minute Exam Strategy
❌ TOP 5 Mistakes Students Make:
1. COCOMO: Calculating E and T but forgetting Team Size
2. Cohesion/Coupling: Writing High Coupling is good (IT'S NOT!)
3. QA vs QC: Using terms interchangeably
4. UI Comparison: Not making a table when asked to compare
5. Design Process: Forgetting to draw diagrams
✅ 2 Mark Questions Strategy:
• Definition (1 line) + Example (1 line) = Full marks
• "List two" = Write EXACTLY 2, not more
• Keep it short — 4-5 lines maximum
• Use bullet points if listing
Example:
Q: Define Cohesion.
Ans: Cohesion measures how focused a module is. High cohesion means module does ONE thing well. Example: A Login module should ONLY handle login, not payment.
✅ 5 Mark Questions Strategy:
• Definition + Types/Steps + Diagram + Example = 5 marks
• COCOMO Numerical: Show ALL steps with formulas
• Comparison: Always draw a table
• Explain: Use subheadings (Benefits:, Disadvantages:)
• Draw diagrams wherever possible (PERT chart, module structure)
Time Management: 2M = 3 mins, 5M = 8 mins
💡 Power Mnemonics (Use These!):
- Design Concepts: ACMCR (Abstraction, Cohesion, Modularity, Coupling, Refinement)
- Planning: SORTED (Scope, Objectives, Resources, Tasks, Estimate, Delegate)
- Risk Steps: IAMM (Identify, Analyze, Mitigate, Monitor)
- Risk Types: TSBPR (Technical, Schedule, Budget, People, Requirements)
- Good UI: SCVFTEMM (Simplicity, Consistency, Visibility, Feedback, Tolerance, Efficiency, Memorability, Meaningful)
- Modular Benefits: TERMS (Testable, Easy, Reusable, Multiple teams, Simple)
❓
Important Questions — PYQ Based
📌 Note: These questions are based on actual Mid Semester Test papers and expected exam pattern. Click on any question to see the clear, point-wise answer.
Section A — 2 Marks Questions (Short Answer)
2M
PYQ 2024-25
Q1. List the major responsibilities of a software project manager.
▼
Answer:
1. Project Planning: Estimating cost, time, and resources (using COCOMO).
2. Scheduling: Creating Gantt/PERT charts and assigning tasks.
3. Risk Management: Identifying potential problems and planning solutions.
2M
PYQ 2024-25
Q2. Classify different types of couplings and their impact on Software Design.
▼
Answer:
Types from Best to Worst:
1. Data Coupling (Best): Modules only pass necessary data.
2. Stamp Coupling: Passing whole data structures instead of specific data.
3. Control Coupling: One module controls the execution flow of another.
4. Content Coupling (Worst): Modules modify each other's code. Highly impacts design negatively.
2M
PYQ 2024-25
Q3. List four fundamental principles of a good user interface design.
▼
Answer:
1. User Familiarity: Use concepts users already know (e.g., folder icon for files).
2. Consistency: Buttons and colors should mean the same thing everywhere.
3. Minimal Surprise: System should behave exactly as the user expects.
4. Recoverability: Let users easily undo mistakes (Ctrl+Z).
2M
PYQ 2024-25
Q4. How does software verification differ from Software Validation?
▼
Answer:
Verification: "Are we building the product right?" (Checking if code follows the design).
Validation: "Are we building the right product?" (Checking if the final software meets customer requirements).
2M
PYQ 2024-25
Q5. For 'Semi-Detached' Project Estimated Size '100 KLOC', calculate effort & time.
▼
Answer:
For Semi-Detached: a = 3.0, b = 1.12, c = 2.5, d = 0.35
1. Effort (E): a * (KLOC)^b = 3.0 * (100)^1.12 = 3.0 * 173.78 = 521.34 Person-Months
2. Time (D): c * (E)^d = 2.5 * (521.34)^0.35 = 2.5 * 8.92 = 22.3 Months
2M
PYQ 2025-26
Q6. Name the two types of documents produced during the design phase.
▼
Answer:
1. HLD (High-Level Design): Defines the overall architecture and modules of the system.
2. LLD (Low-Level Design): Defines the detailed logic, algorithms, and data structures for individual modules.
2M
PYQ 2025-26
Q7. How good software design contributes to software quality?
▼
Answer:
1. A good design makes the software easy to understand and modify, improving maintainability.
2. It reduces bugs and errors during coding by providing a clear blueprint, improving reliability.
2M
PYQ 2025-26
Q8. Define coupling and cohesion. State their impact on software maintainability.
▼
Answer:
Cohesion: How closely related the functions inside a single module are. (Should be HIGH).
Coupling: How strongly different modules depend on each other. (Should be LOW).
Impact: High cohesion and low coupling make modules independent, meaning changes in one module don't break others, making maintenance extremely easy.
2M
PYQ 2025-26
Q9. Identify any two project scheduling tools.
▼
Answer:
1. Gantt Charts: Horizontal bar charts showing task durations and overlap.
2. PERT Charts (Program Evaluation Review Technique): Network diagrams showing dependencies between tasks.
2M
PYQ 2025-26
Q10. State any two benefits of modular software design.
▼
Answer:
1. Reusability: A module written once can be reused in different programs.
2. Parallel Development: Different teams can work on different modules simultaneously, speeding up development.
2M
Expected
Q11. Define Software Architecture and its significance.
▼
Answer:
Software Architecture: The fundamental organization of a system, its components, their relationships, and the rules guiding its design.
Significance: It provides a solid foundation for building the system, dictates performance/security, and makes code scalable.
2M
Expected
Q12. What is a Gantt chart, and why is it used in project scheduling?
▼
Answer:
A Gantt chart is a bar chart showing the timeline of a project. It is used to easily visualize start/end dates of tasks and see which tasks are running in parallel.
2M
Expected
Q13. Briefly explain the difference between Black Box Testing and White Box Testing.
▼
Answer:
Black Box: Tester doesn't know the internal code. Checks only inputs and outputs (e.g., trying to login with wrong password).
White Box: Tester knows the internal code. Checks loops, conditions, and line-by-line logic inside the program.
2M
Expected
Q14. What are the three modes of the Basic COCOMO Model?
▼
Answer:
1. Organic: Small team, simple common project (e.g., student app).
2. Semi-Detached: Medium team, mixed experience, moderate complexity (e.g., database management system).
3. Embedded: Highly complex, rigid hardware constraints (e.g., airplane control software).
2M
Expected
Q15. Define Risk Management in the context of Software Engineering.
▼
Answer:
Risk management involves identifying, analyzing, and resolving potential problems before they severely damage the project. Steps: Risk Identification → Risk Analysis → Risk Planning → Risk Monitoring.
Section B — 5 Marks Questions (Long Answer)
5M
PYQ 2024-25
Q16. For 100 KLOC Organic System, calculate effort & time. Re-calculate if changed to Semi-Detached. Provide Analysis.
▼
Answer:
Case 1: Organic (a=2.4, b=1.05, c=2.5, d=0.38)
Effort = 2.4 * (100)^1.05 = 2.4 * 125.89 = 302.14 PM
Time = 2.5 * (302.14)^0.38 = 2.5 * 8.87 = 22.1 Months
Case 2: Semi-Detached (a=3.0, b=1.12, c=2.5, d=0.35)
Effort = 3.0 * (100)^1.12 = 3.0 * 173.78 = 521.34 PM
Time = 2.5 * (521.34)^0.35 = 2.5 * 8.92 = 22.3 Months
Analysis:
Semi-Detached requires vastly more effort (521 vs 302 PM) because the difficulty and complexity of the project increased, requiring more skilled engineers, though the time duration remains roughly the same due to adding more people in parallel.
5M
PYQ 2024-25
Q17. Demonstrate different types of cohesion with suitable examples.
▼
Answer:
Cohesion is how tightly bound the elements within a module are. Types from Worst to Best:
1. Coincidental (Worst): Random tasks grouped together. Example: A module containing `Print_Report()` and `Calculate_Tax()` with no relation.
2. Logical: Tasks grouped logically, like all error handlers. Example: `Handle_All_Errors()`.
3. Temporal: Linked by time of execution. Example: `System_Startup()` loading DB, UI, and network config.
4. Procedural: Grouped to follow a specific sequence. Example: `Check_File()`, then `Read_File()`.
5. Functional (Best): Module performs exactly ONE single task perfectly. Example: `Calculate_Employee_Salary()`.
5M
PYQ 2025-26
Q18. Project: Organic type, Size: 60 KLOC. Use Basic COCOMO to compute Nominal Effort and Development Time.
▼
Answer:
For Organic Type: a = 2.4, b = 1.05, c = 2.5, d = 0.38
1. Nominal Effort (E):
E = a * (KLOC)^b
E = 2.4 * (60)^1.05
E = 2.4 * 72.84 ≈ 174.8 Person-Months
2. Development Time (D):
D = c * (E)^d
D = 2.5 * (174.8)^0.38
D = 2.5 * 7.15 ≈ 17.8 Months
5M
PYQ 2025-26
Q19. Discuss how UI design decisions influence system usability, user satisfaction, and software acceptance.
▼
Answer:
UI is the only part of the software the customer directly interacts with, acting as the bridge between human and machine.
1. Usability: A clear design with familiar icons reduces learning time. If a user can perform tasks without training, usability is high.
2. User Satisfaction: Consistent layouts (like "Back" button always on top left) make users feel in control. Confusing UI frustrates users, making them abandon the software.
3. Software Acceptance: Even if the backend code is perfect and complex, a terrible, ugly UI will cause the client to reject the product.
Example: Why is Google Search so successful? Because its UI is literally just one simple text box!
5M
Expected
Q20. Explain the various software testing levels in detail (Unit, Integration, System, Acceptance testing).
▼
Answer:
1. Unit Testing: Testing the smallest individual piece of code (a single function). Done by the developers.
2. Integration Testing: Combining tested units and testing them together to find errors in their interaction (interfaces/data passing).
3. System Testing: Testing the complete, fully integrated software application to ensure it meets requirements. Checks security, load, and performance.
4. Acceptance Testing: Final test done by the customer/client before signing off. (Alpha and Beta testing).
5M
Expected
Q21. Compare different types of Coupling with examples. Explain which is the best and worst.
▼
Answer:
Coupling measures interdependence. We want LOW coupling.
1. Data Coupling (Best): Modules pass only simple, necessary parameters. Example: Passing `Principal` and `Rate` to `Calculate_Interest()`.
2. Stamp Coupling: Passing an entire data structure when only a part is needed. Example: Passing entire `Employee_Object` just to print `Employee_Name`.
3. Control Coupling: A module passes a flag to control what another module does. Example: Passing `flag=true` to force a module into a specific mode.
4. Content Coupling (Worst): One module directly edits the internal data or code of another module. Breaks all security and independence!